Let’s imagine for a moment that we both live in a small city by a nice lake. I go fishing in the lake, you play volleyball by the lake, and everyone else does fun things at the lake. Then, the next morning we all discover something shocking: a nearby old sewer line has ruptured, contaminating the entire lake. City officials reveal that they don’t have funding to cleanup the lake. A cacophonous uproar ensues until someone proposes: each person in the city voluntarily provides funding to cleanup the lake. After all, everyone appears to care so much about the lake, what could possibly go wrong?

The story above highlights what is known as a Public Good problem. A public good is a commodity, product, or service that benefits all members of a given population. The clean lake happens to be the public good and the given population is the people living in the small city. The classic tension that arises is that everyone gets to enjoy the clean lake even if they don’t contribute to the cleaning of it. That is, every indidvidual - whether they go fishing or play volleyball - has an incentive to free-ride on the contributions provided by others.
MobLab’s Public Good: Linear economics game continues the story of the lake but puts what happens next in the hands of your students. Students choose how much funding to contribute to the cleansing of the public good (the lake purification project). The benefit derived from the public good increases linearly with total contributions. This is a great environment to study the distinction between individual incentives and collective interests: the individual receives less than $1 in benefit from contributing $1, but the group's benefit is greater than $1.
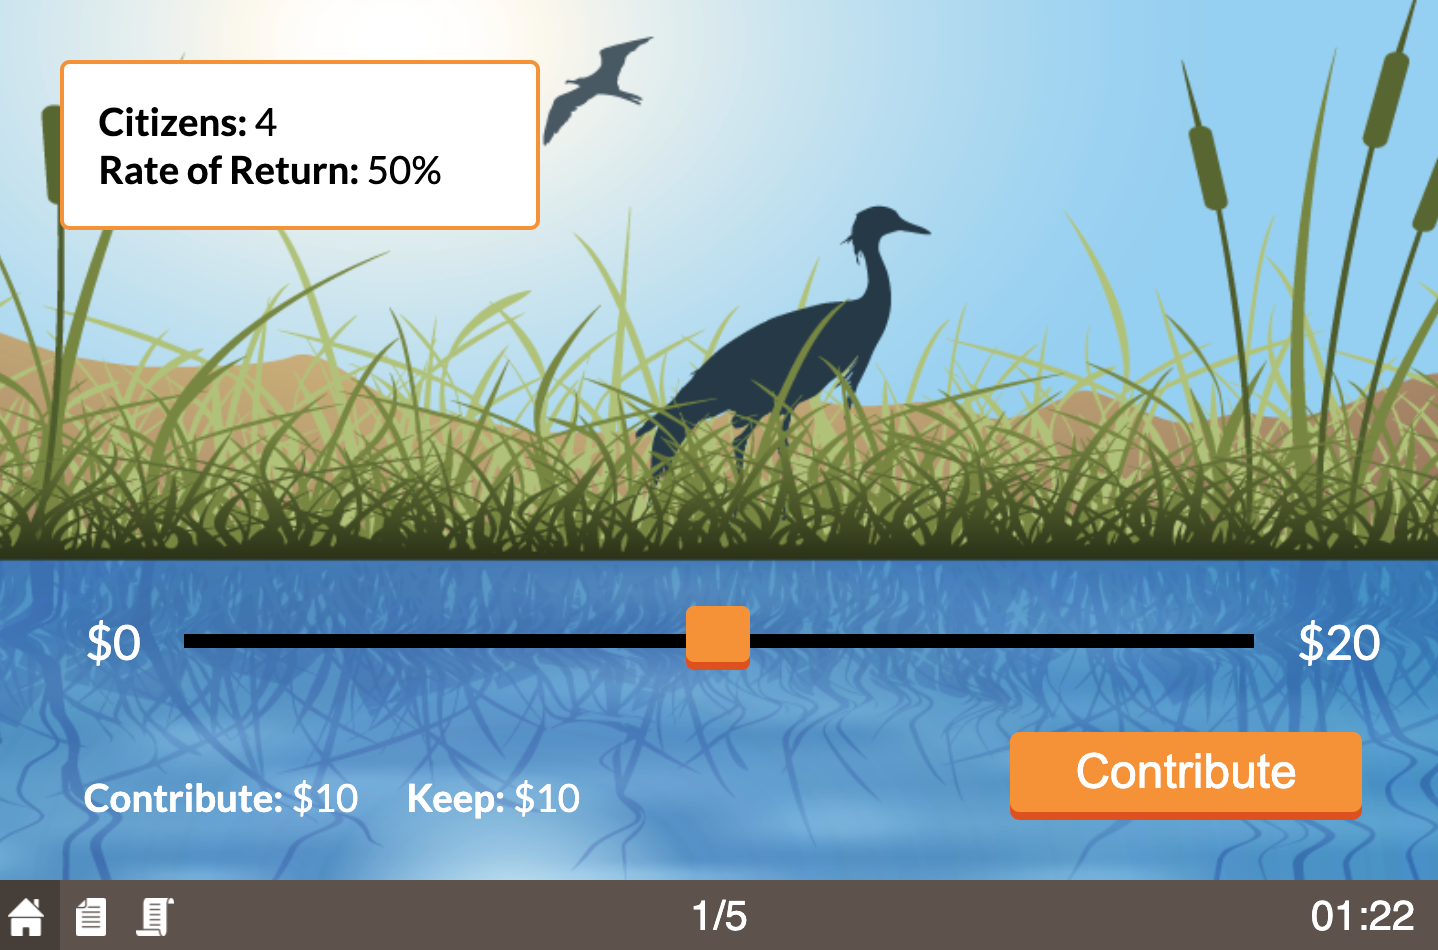
In the game, the Rate of Return (%) is each group member’s benefit from a $1 contribution to cleaning up the lake. Contribution increases result in a surplus when the Rate of Return (%) × Group Size is greater than 1. When this happens, the efficient outcome has each player contributing their entire endowment.
With the default parameters (Rate of Return (%)=50%; Group Size=4), contribution is efficient. However, a common outcome is a moderate level of initial contributions (about half of the group endowment, on average), diminishing with each passing round. A problem known to economist as free-riding.1. Enabling Chat in the game will generally increase contributions as it may help foster a norm of giving. Historically, this phenomena was discovered in 1973 by Elinor Ostrom and her husband Oliver Williamson. Elinor Ostrom was the first woman to win the Nobel Prize in Economics, along with her husband, for their work in public choice theory and public economics. 2. Increasing the Rate of Return will generally increase contributions. 3. Increasing Group Size (holding constant the rate of return) may well increase contributions, potentially because of the increase in societal benefits per unit of individual contribution.
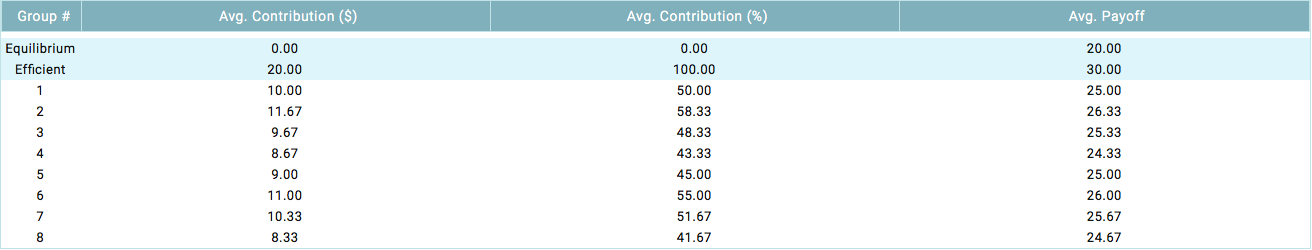
The table shows contributions and average payoffs for each group for the chosen round, as well as for the equilibrium and efficient benchmarks. It will show that higher contributing groups will have higher average payoffs. You may click the column header to sort by that column.
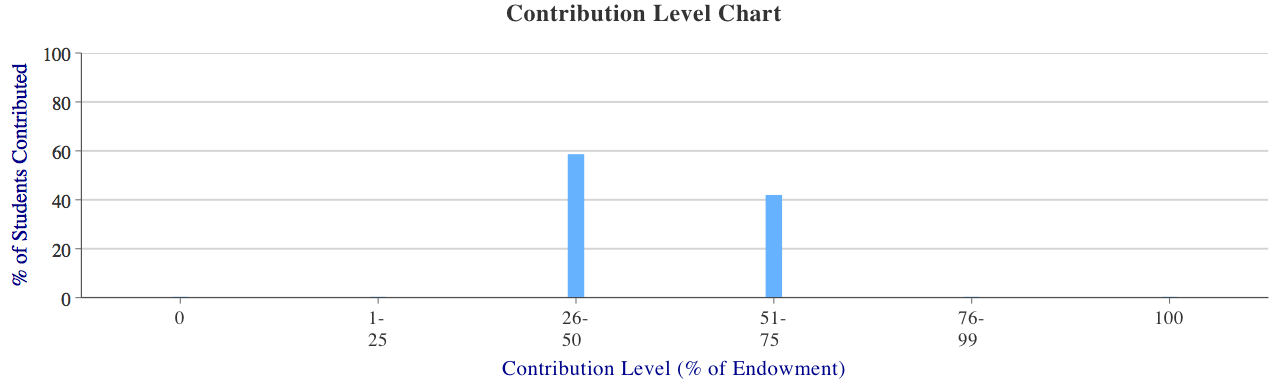
This chart shows the distribution of contributions in the chosen round. While early-round contributions will be widely distributed, by later rounds most players will choose little or no contributions. This gradually diminishing of contributions in each subsequent round illustrates evidence of free-riding.
Contributions Across Rounds:
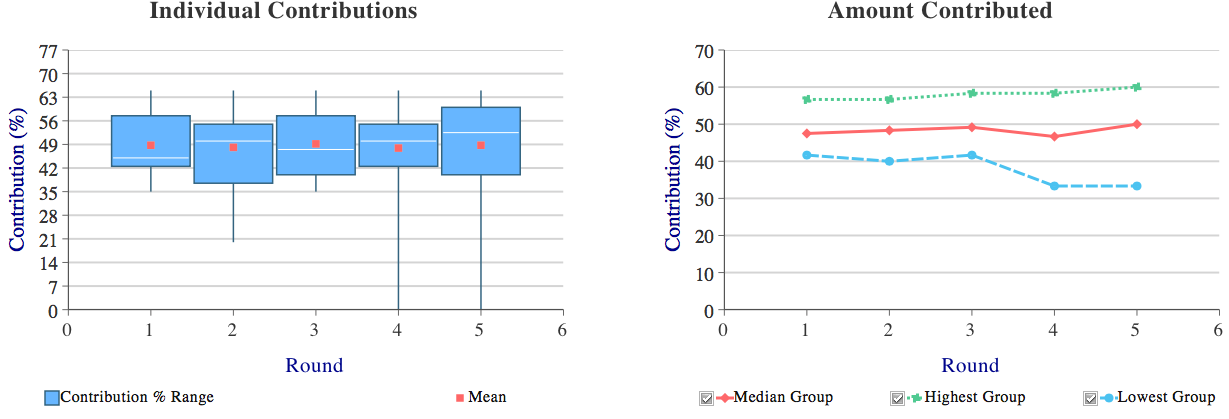
The two charts below summarize contributions across rounds. On the left, the box-and-whiskers chart summarizes contributions at the individual level, showing for each round the inter-quartile range of contributions (the box) as well as the minimum and maximum contribution (the whiskers). In addition, the mean is indicated with a red marker and the median with a white line within the box. On the right, the chart summarizes contributions by round at the group level. On the vertical axis, we display group contributions as a percentage of group endowments, and plot for each round the highest, lowest and median contributing group.
Note how free-riding is dynamically shown in the charts. The box-and-whiskers plot ranges are the longest in the 4th and 5th rounds indicating that free-riding does exist. Visually, we can see free-riding based on player Groups more clearly in the Amount Contributed chart. Here, the Lowest Group (blue line) does indeed exhibit free-riding behavior due to diminishing contributions in each subsequent round. In contrast, the Highest Group (green line) does not exhibit free-riding behavior. In fact, the opposite contribution behaviors of both groups results in what appear to be a relatively static median (red line). This is a great example of how divergent group behaviors can exist within a public good. Not everyone will exhibit the same expectation of behavior as this example clearly shows. All groups do not contribute diminishing amounts each round.
Public Goods in economics is about decision-making strategies, and with MobLab’s Public Good: Linear, you can give your students this hands-on experience. So will they favor the collective interest to purify the lake or will they prioritize personal welfare? Play to find out!
Check out our catalog for additional Public Choice games or contact us for a personalized demo!

Clean lakes are happy lakes… but who will pay for it?
Photo by Vivek Sharma
Photo by Vivek Sharma
The story above highlights what is known as a Public Good problem. A public good is a commodity, product, or service that benefits all members of a given population. The clean lake happens to be the public good and the given population is the people living in the small city. The classic tension that arises is that everyone gets to enjoy the clean lake even if they don’t contribute to the cleaning of it. That is, every indidvidual - whether they go fishing or play volleyball - has an incentive to free-ride on the contributions provided by others.
MobLab’s Public Good: Linear economics game continues the story of the lake but puts what happens next in the hands of your students. Students choose how much funding to contribute to the cleansing of the public good (the lake purification project). The benefit derived from the public good increases linearly with total contributions. This is a great environment to study the distinction between individual incentives and collective interests: the individual receives less than $1 in benefit from contributing $1, but the group's benefit is greater than $1.
In the game, the Rate of Return (%) is each group member’s benefit from a $1 contribution to cleaning up the lake. Contribution increases result in a surplus when the Rate of Return (%) × Group Size is greater than 1. When this happens, the efficient outcome has each player contributing their entire endowment.
With the default parameters (Rate of Return (%)=50%; Group Size=4), contribution is efficient. However, a common outcome is a moderate level of initial contributions (about half of the group endowment, on average), diminishing with each passing round. A problem known to economist as free-riding.
Treatment Variations to Try with Students
Results
Group Outcomes in a Particular Round:The table shows contributions and average payoffs for each group for the chosen round, as well as for the equilibrium and efficient benchmarks. It will show that higher contributing groups will have higher average payoffs. You may click the column header to sort by that column.
Group Outcomes in Particular Round
Distribution of Contributions: This chart shows the distribution of contributions in the chosen round. While early-round contributions will be widely distributed, by later rounds most players will choose little or no contributions. This gradually diminishing of contributions in each subsequent round illustrates evidence of free-riding.
Distribution of Contributions
Contributions Across Rounds:
The two charts below summarize contributions across rounds. On the left, the box-and-whiskers chart summarizes contributions at the individual level, showing for each round the inter-quartile range of contributions (the box) as well as the minimum and maximum contribution (the whiskers). In addition, the mean is indicated with a red marker and the median with a white line within the box. On the right, the chart summarizes contributions by round at the group level. On the vertical axis, we display group contributions as a percentage of group endowments, and plot for each round the highest, lowest and median contributing group.
Note how free-riding is dynamically shown in the charts. The box-and-whiskers plot ranges are the longest in the 4th and 5th rounds indicating that free-riding does exist. Visually, we can see free-riding based on player Groups more clearly in the Amount Contributed chart. Here, the Lowest Group (blue line) does indeed exhibit free-riding behavior due to diminishing contributions in each subsequent round. In contrast, the Highest Group (green line) does not exhibit free-riding behavior. In fact, the opposite contribution behaviors of both groups results in what appear to be a relatively static median (red line). This is a great example of how divergent group behaviors can exist within a public good. Not everyone will exhibit the same expectation of behavior as this example clearly shows. All groups do not contribute diminishing amounts each round.
Contributions Across Rounds
Public Goods in economics is about decision-making strategies, and with MobLab’s Public Good: Linear, you can give your students this hands-on experience. So will they favor the collective interest to purify the lake or will they prioritize personal welfare? Play to find out!
Check out our catalog for additional Public Choice games or contact us for a personalized demo!