We know that many in our community love getting their hands on data and gleaning useful insights to inform our decision-making. So, we at MobLab want to “Pull back our curtains” and share some things that we have learned from running analytics on our economics games. Nothing is more exciting, after all, than seeing our theoretical brainchildren be pitted against the uncompromising reality of data. You might have seen our previous post on our publication in Nature Human Behavior but since we have a lot of data and games to choose from, we want to go a bit more into the details and share what we have learned with you. That is why we will make this a three-part series treating various games in turn. We start with our flagship economics principles game - Competitive Market!
Commodity Market Equilibrium Price and Equilibrium Price
In his seminal paper, Vernon Smith (1962) laid the groundwork for now almost 60 years of research on how well the supply and demand model is able to predict market outcomes for a vast array of parameter settings. One of the most astounding results has been the relative stability with which even markets with a small number of participants can converge over time to the predicted equilibrium price.
MobLab’s Adaptation
In the spirit of Vernon’s work, we have created a competitive market game that uses a double auction mechanism with the storytelling of a market for oranges. One distinguishing feature is that in this market, any time there is an overlap of a bid by a buyer and an ask of a seller the orange gets transacted. In this way, the game has real-time feedback for buyers and sellers through executed transactions to provide information on potential prices to equilibrate the market. Buyers and Sellers face a game interface that provides them with all the information they need to make informed decisions about their bids and asks.
We dug through our servers and have analyzed transaction data from N= 766 sessions where 5 buyers and 5 sellers had values and costs for 3 units each with a round duration of 120 seconds. We have of course many more observations but wanted to highlight that the parameter set we have chosen works particularly well.
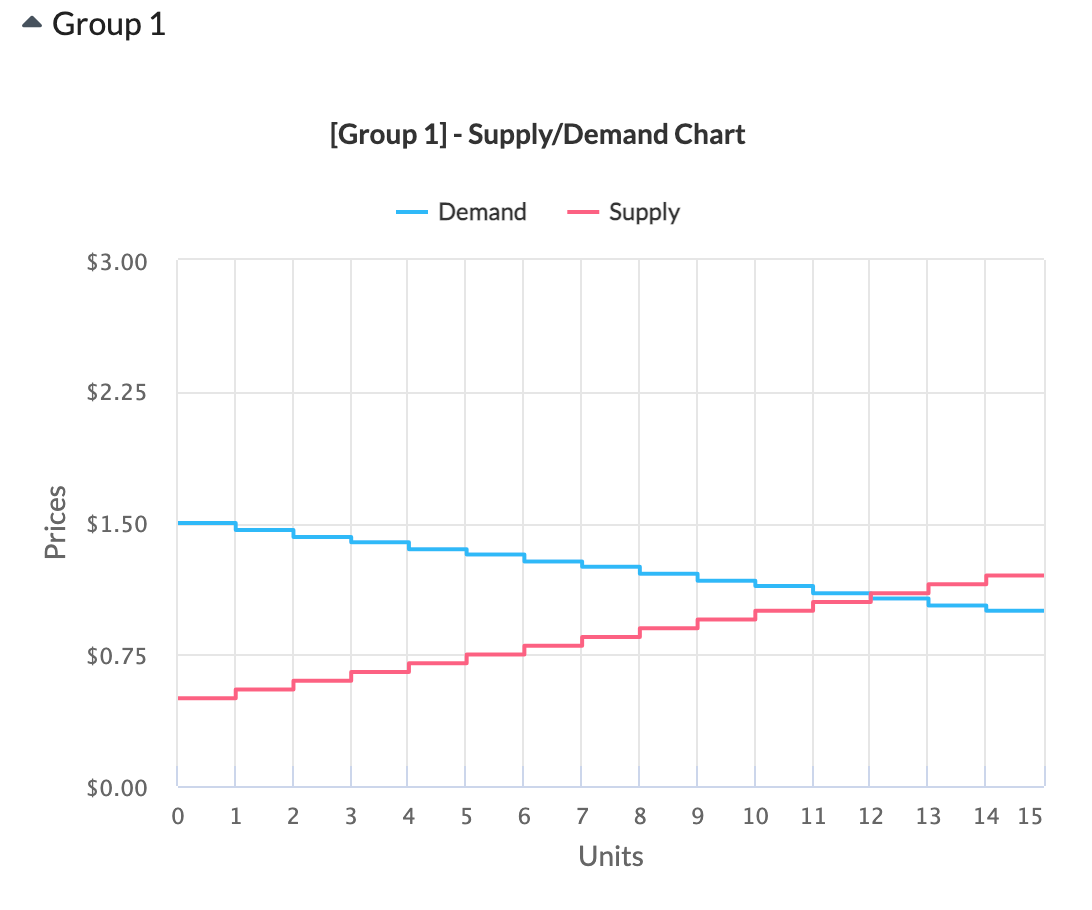
The predicted equilibrium price based on Supply and Demand would be at about 108.5 cents (taking the midpoint of the overlapping range). This happens to be the default configuration if you add the game to your playlist and run it without any modification. The fact that this configuration has good results shows that we at MobLab make sure to take that work off of your shoulders.
First some summary statistics. The table below shows the percentages of prices that fell within Equilibrium price +/- 15 cents by 10 second intervals of the 2 min trading period.

Figure 3. Summary table of trading by ten-second intervals We observe that we start at about 42% percent trades within the equilibrium price interval during the first 10 seconds of any period and reach about 75% for the last 10 seconds of the game. That is a significant convergence over time towards the actual equilibrium. This could be further strengthened since we did not drop any irrational behavior (e.g. trading at a loss) which would improve these numbers.
Graphically, we can see the convergence depicted in Figure 4.
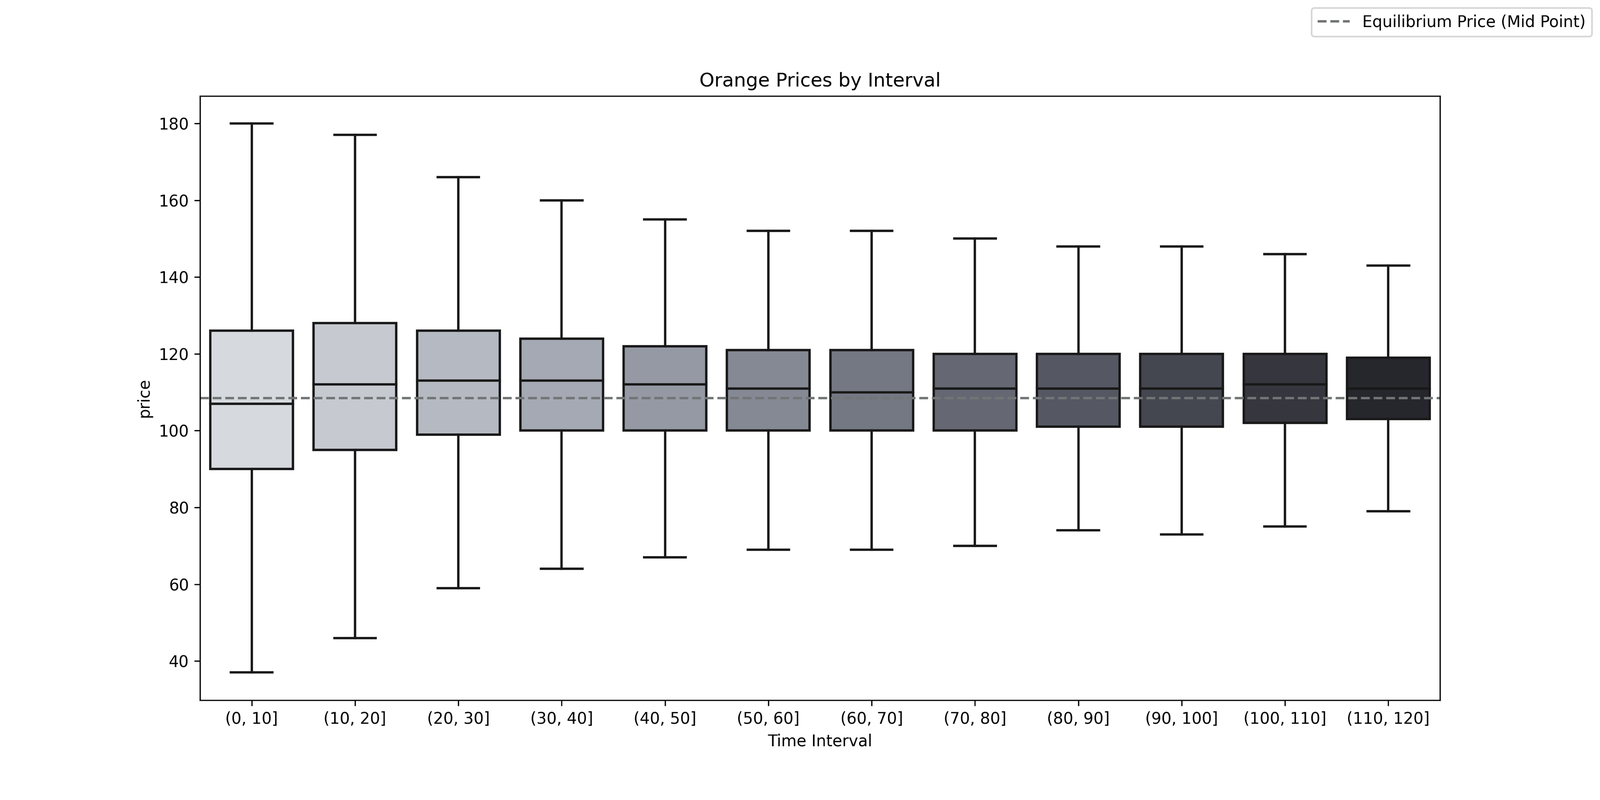
This depiction is slightly different, as we are using the quartiles rather than the pre-defined +/- 15 cents from the equilibrium price. The inference is the same though, as we see that the quartiles and the box tighten significantly over time which demonstrates the robustness of the institution to convergence. This is in spite of the relatively “thin” market with 10 total traders and a total of 15 units that cannot be re-traded. The largest adjustments take place roughly in the first 50-60 seconds at which point the convergence is relatively stable around the equilibrium price.
It is noteworthy to point out that most of these students will typically be graded on participation and therefore are not incentivized according to standard laboratory procedures. This emphasizes the robustness of the market to lead to predicted outcomes.
Conclusion
What did we learn? We are proud to show that Vernon Smith was right on a much larger scale than he likely ever imagined and we uncover another tangible piece of evidence for Adam Smith’s famous invisible hand. We are also happy to show that our default settings set you up for success and decrease any uncertainty about how the classroom experiment will go.
For further large-scale analysis of our experimental data, you can read up on our work at or stay tuned for further posts coming up in this “Pulling back our curtains” series.
Want to see how your students reach equilibrium? Get in touch with our team! We are eager to set it up for your class!
Commodity Market Equilibrium Price and Equilibrium Price
In his seminal paper, Vernon Smith (1962) laid the groundwork for now almost 60 years of research on how well the supply and demand model is able to predict market outcomes for a vast array of parameter settings. One of the most astounding results has been the relative stability with which even markets with a small number of participants can converge over time to the predicted equilibrium price.
MobLab’s Adaptation
In the spirit of Vernon’s work, we have created a competitive market game that uses a double auction mechanism with the storytelling of a market for oranges. One distinguishing feature is that in this market, any time there is an overlap of a bid by a buyer and an ask of a seller the orange gets transacted. In this way, the game has real-time feedback for buyers and sellers through executed transactions to provide information on potential prices to equilibrate the market. Buyers and Sellers face a game interface that provides them with all the information they need to make informed decisions about their bids and asks.
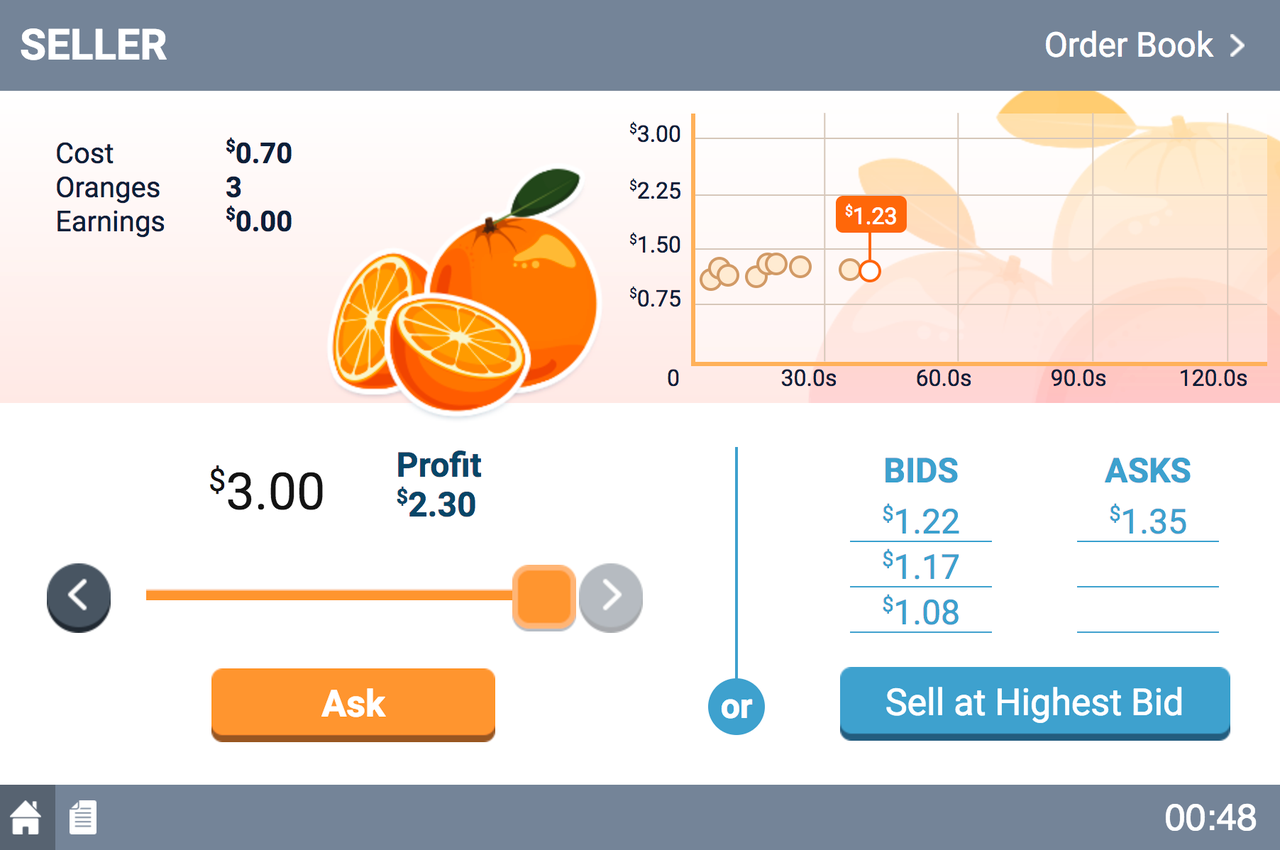
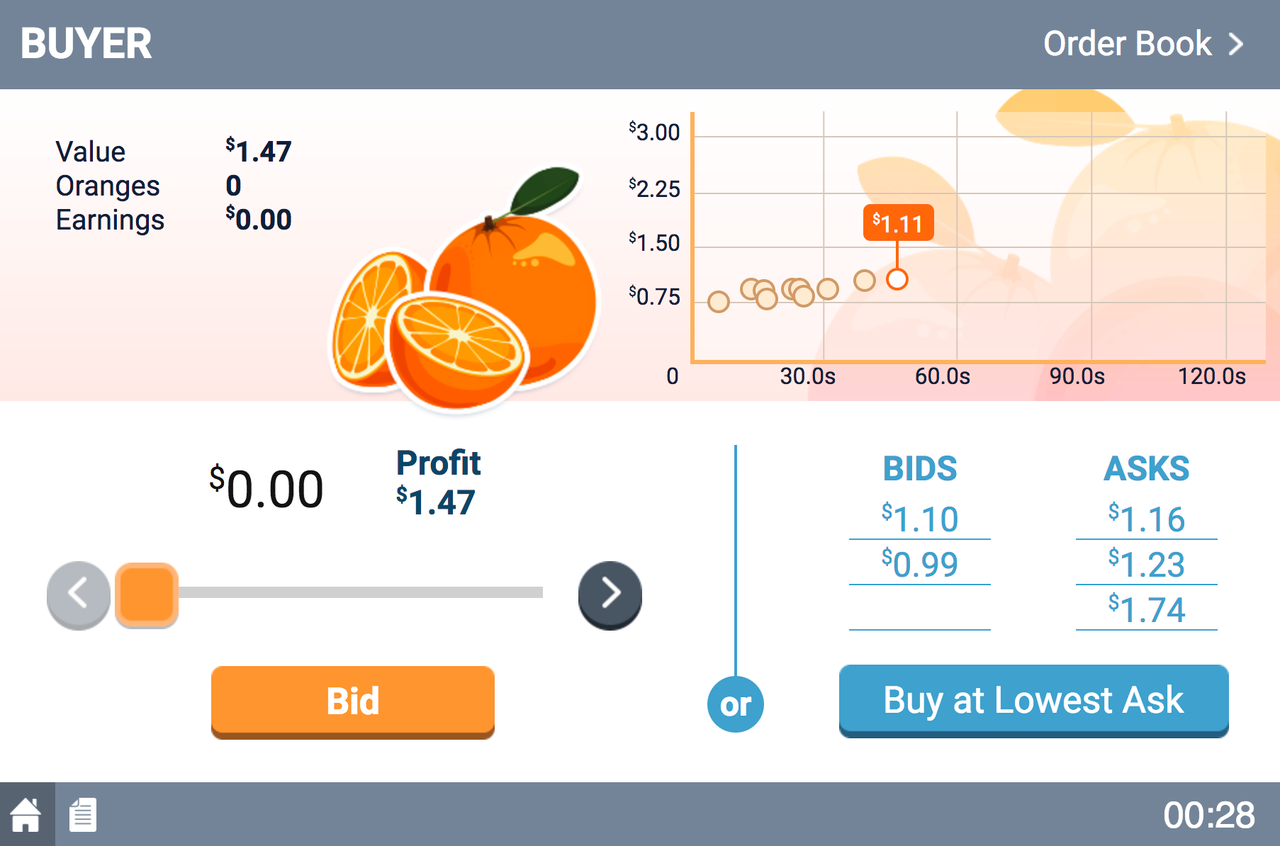 Figure 1a: Seller Interface Figure 1b: Buyer Interface
The Data
Usually, economists run experiments on these kinds of markets with sample sizes that reach maybe 100 or more. Now imagine if you had over a thousand participants and over 500 markets of 5 buyers and 5 sellers randomly picked trading with the same values and costs over a period of 2 minutes. An experimenters dream? Utopia? A reality with MobLab! We dug through our servers and have analyzed transaction data from N= 766 sessions where 5 buyers and 5 sellers had values and costs for 3 units each with a round duration of 120 seconds. We have of course many more observations but wanted to highlight that the parameter set we have chosen works particularly well.
The predicted equilibrium price based on Supply and Demand would be at about 108.5 cents (taking the midpoint of the overlapping range). This happens to be the default configuration if you add the game to your playlist and run it without any modification. The fact that this configuration has good results shows that we at MobLab make sure to take that work off of your shoulders.
Figure 2. Supply and Demand Plot
First some summary statistics. The table below shows the percentages of prices that fell within Equilibrium price +/- 15 cents by 10 second intervals of the 2 min trading period.
Graphically, we can see the convergence depicted in Figure 4.
Figure 4. Boxplot of trading prices across time intervals
This depiction is slightly different, as we are using the quartiles rather than the pre-defined +/- 15 cents from the equilibrium price. The inference is the same though, as we see that the quartiles and the box tighten significantly over time which demonstrates the robustness of the institution to convergence. This is in spite of the relatively “thin” market with 10 total traders and a total of 15 units that cannot be re-traded. The largest adjustments take place roughly in the first 50-60 seconds at which point the convergence is relatively stable around the equilibrium price.
It is noteworthy to point out that most of these students will typically be graded on participation and therefore are not incentivized according to standard laboratory procedures. This emphasizes the robustness of the market to lead to predicted outcomes.
Conclusion
What did we learn? We are proud to show that Vernon Smith was right on a much larger scale than he likely ever imagined and we uncover another tangible piece of evidence for Adam Smith’s famous invisible hand. We are also happy to show that our default settings set you up for success and decrease any uncertainty about how the classroom experiment will go.
For further large-scale analysis of our experimental data, you can read up on our work at or stay tuned for further posts coming up in this “Pulling back our curtains” series.
Want to see how your students reach equilibrium? Get in touch with our team! We are eager to set it up for your class!